
Sri Lanka - The Strategic Apparel Destination
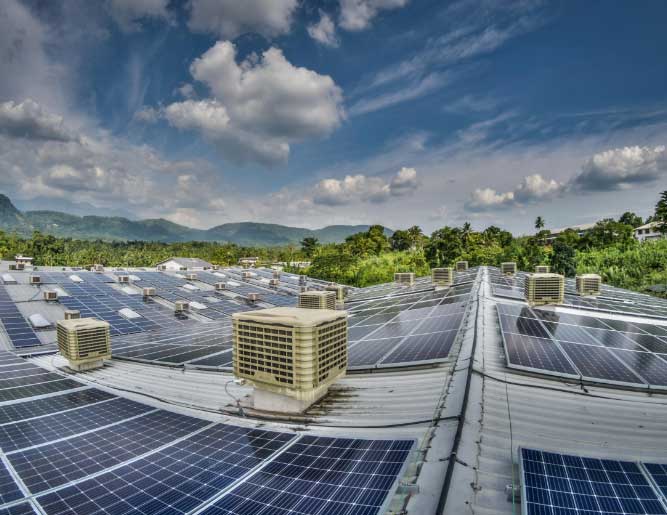
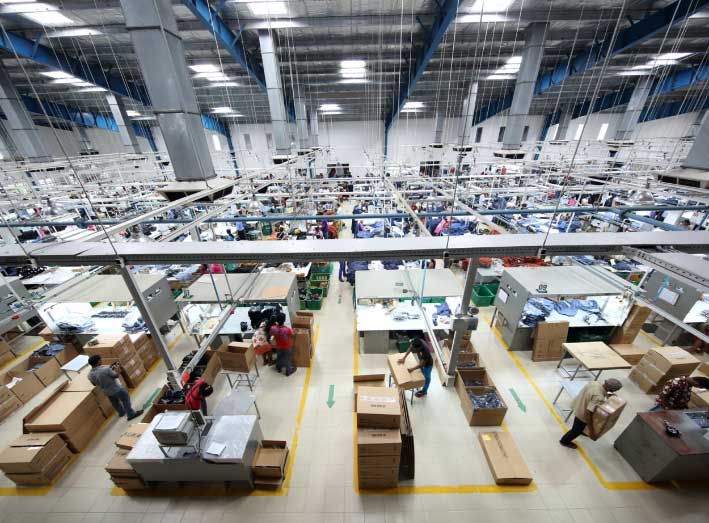
For over three decades, Sri Lanka has built a reputation as a world-class apparel sourcing destination for the global fashion industry. It is a beautiful island, strategically located near major regional shipping routes to the United States of America, Europe, South Asia and the Far East, offering shorter lead times and cost-effective shipping. While productivity and speed are Sri Lanka's hallmarks, its reputation as a no-sweatshop, ethical environment for a highly educated, multi-cultural workforce, make it an ideal location to do business. Further, the island's close proximity to the Indian sub-continent positions it as a gateway to a market of 1.3 billion people.
Explore The IsleShaping the Sri Lankan Apparel Industry
The Sri Lankan Apparel Exporters Association is the pioneer association representing the country’s apparel exporters. The association’s membership accounts for over 70% of the country’s apparel exports.
Who We Are
42
YEARS OF
EXPERIENCE
Annual Export Revenue
January - December 2023

All countries
Cumulative

USA
Cumulative

EU
Cumulative

SLAEA Members
Founded in 1982, the Sri Lanka Apparel Exporters Association is the pioneer association for the apparel exporters industry in Sri Lanka. It has a membership of 72 apparel manufacturers in the country, sharing the ultimate goal of making Sri Lanka the number one apparel sourcing destination in the world.
Giving Back

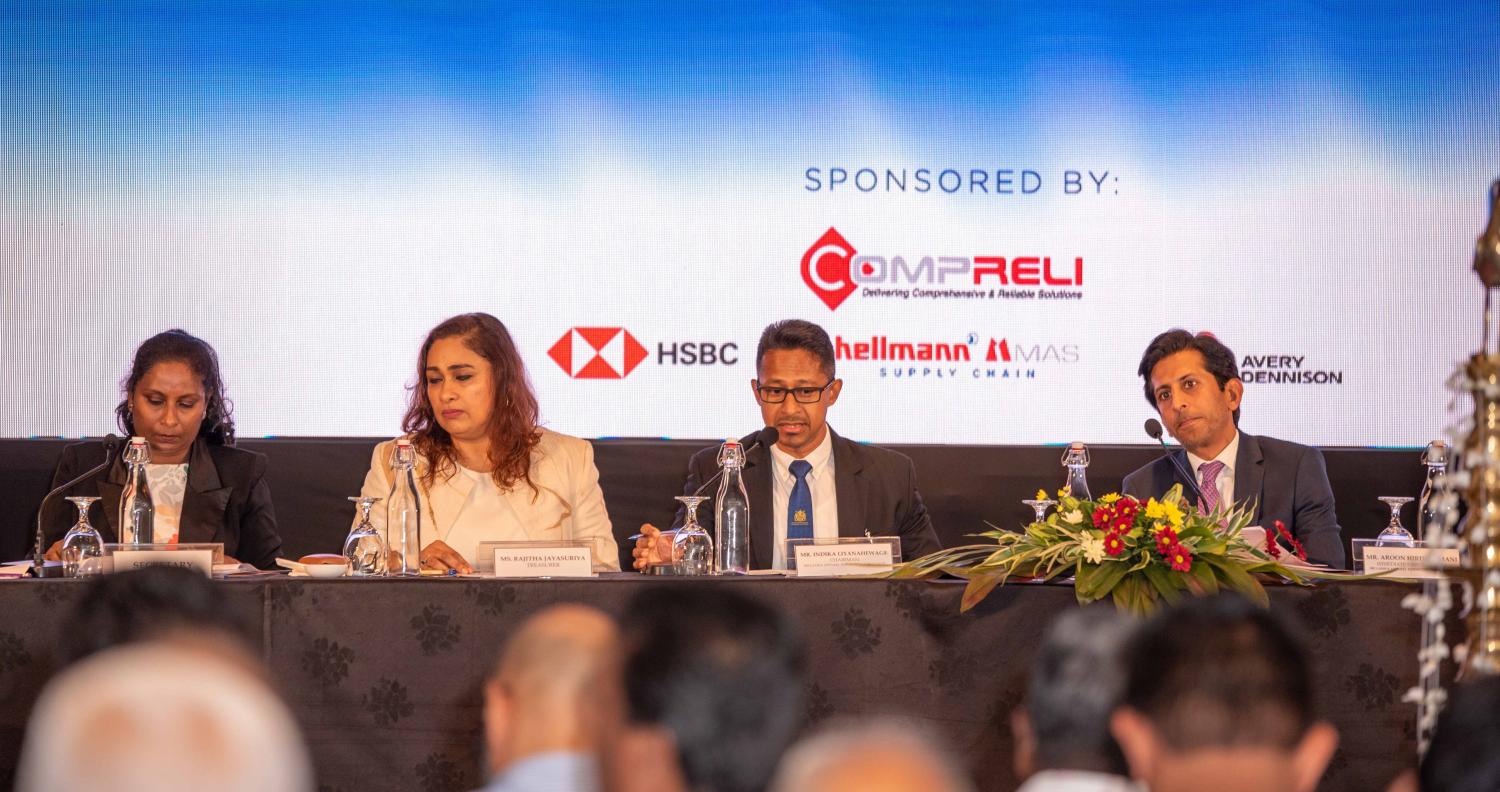

Our Sponsors

Gold Sponsor